Other posts
-
Or, torturing compilers for fun and profit. I recently tweeted an interesting C# challenge: C# Quiz: Construct a valid program which remains valid when a single = token is removed.— Schabse Laks (@Schabse) December 21, 2016 This has enough solutions to warrant a blog post, explaining how each answer works. Note that you must remove an `=` character _which is parsed as a single token_; that means you can't remove an `=` from a comment (which is not a token at all), or one which is merely part of a larger token like `>=`, `=>`, `==`, or `!=`. The `=`...
-
When writing code that deals with security or cryptography, there are a number of mistakes that many people make; some obvious and some quite subtle. This post describes the most common mistakes I've seen and why they're wrong. # Don't re-invent the car Correctly using cryptographic primitives is _hard_. If at all possible, you should not use raw cryptographic primitives (even well-accepted ones like AES, RSA, or SHA2) directly; instead, you should use professionally-built and reviewed protocols that use these systems, such as TLS, [NaCl](https://nacl.cr.yp.to/), [Keyczar](https://github.com/google/keyczar), and others. There are a variety of subtle issues that professional cryptographers know about...
-
The entire field of computer security is dedicated to verifying the source, confidentiality, or integrity of information or communication. This includes guaranteeing that the web page or other resource you're seeing actually came from the entity you're trying to reach (and has not been modified); guaranteeing that information you transmit will only be readable by that entity, or that the user connecting to a server is actually in possession of a token. This raises a problem. Security may be all about trust and authentication, but how can you establish that trust in the first place? Without some existing indicator of...
-
Web authentication systems have evolved over the past ten years to counter a growing variety of threats. This post will present a fictional arms race between a web application developer and an attacker, showing how different threats can be countered with the latest security technologies. This entire conversation assumes that the user has already legitimately established some form of trust anchor (eg, a password or hardware token) with the defender before the attacker came onto the scene. Cryptography [can only be used](https://blogs.msdn.com/b/ericlippert/archive/2011/09/27/keep-it-secret-keep-it-safe.aspx) to transfer existing trust or secrecy across time or space; if the attacker impersonates the defender before the...
-
Writing accurate, maintainable CSS for large websites requires careful planning and meticulous attention to detail. One detail that can often slip through the gaps is proper spacing between elements. If a view has a number of independent, optional components laid out in a vertical (or horizontal) stack, it can be tricky to ensure that each piece has correct spacing around it in all configurations.
I've found that
-
_This post is part of a [series](/#code-snippets) of blog posts called code snippets. These blog posts will explore successively more interesting ways to do simple tasks or abuse language features._ I recently set out to create snippets of code that have nothing inherently wrong with them, but can never appear in a valid program. # Impossible accessibility The simplest example is a statement that uses `internal` types from two different assemblies, so that there is no project that it could legally appear in: ```csharp // In A.dll: public class Base { internal static void Method() { } } // In...
-
_This post is part of a [series](/#code-snippets) of blog posts called code snippets. These blog posts will explore successively more interesting ways to do simple tasks or abuse language features._ Reflection is great for accessing all properties (or an arbitrary property named at runtime) of an arbitrary type. However, Reflection has performance costs which can be unacceptable in critical codepaths. Instead, you can add an upfront cost and create generic delegates to read or write such properties without any overhead at all (depending on what you're doing with the values, you can even avoid boxing). The typical goal for this...
-
_This post is part of a [series](/#code-snippets) of blog posts called code snippets. These blog posts will explore successively more interesting ways to do simple tasks or abuse language features._ Javascript's [`bind()` method](https://developer.mozilla.org/en-US/docs/Web/JavaScript/Reference/Global_Objects/Function/bind) (new to ES5) is very useful for passing callbacks or event handlers that use an existing `this`. It also has some more confusing uses, especially when combined with `call()` or `apply()`. If you have an array of functions, and you want to execute every function in the array, you can write ```js myFuncs.forEach(function(f) { f(); }); ``` However, all you're really doing is calling `.call()` on every...
-
_This post is part of a [series](/#code-snippets) of blog posts called code snippets. These blog posts will explore successively more interesting ways to do simple tasks or abuse language features._ C++ introduced [Variadic Templates](https://en.wikipedia.org/wiki/Variadic_template) – template classes or functions that can take an arbitrary number of template parameters (like varargs/paramarray function parameters). This feature has a number of uses. It's the simplest way arbitrary tuple or function types. It's also useful when making a function that can take an arbitrary number of objects or delegates. C# does not support this feature. For variadic types, there is no direct workaround; this...
-
_This post is the beginning of a new [series](/#code-snippets) of blog posts called code snippets. These blog posts will explore successively more interesting ways to do simple tasks or abuse language features._ When writing C#, you will occasionally need to check whether an object is an instance of a certain type (eg, `Button`), and use part of that type if it is. This is most commonly written as ```csharp object x = ...; if (x is Button) { var b = (Button) x; // Use b... } ``` This approach is simple and readable. However, it has an unnecessary performance...
-
[Last time](/2015-06-10/advanced-promise-usage), I described more advanced patterns for complicated workflows involving asynchronous operations. These patterns can be annoying to write. However, modern compilers can bear the brunt of this complexity, allowing you to write code as if the operations were synchronous, then letting the compiler transform your code into mes promise chains. C# 5 introduces this with its flagship new [`async` / `await` keywords](https://msdn.microsoft.com/en-us/library/hh191443). However, the wealth of possibilities opened by this feature has left many developers confused about when to make `async` methods and when not to. # Non-blocking IO The `async` keyword does not _create_ asynchrony; instead, it...
-
[Last time](/2015-01-08/comparing-different-languages-promises-frameworks), I listed standard & third-party promise libraries in popular languages, comparing how each one implements the promise paradigm. In this post, I'll describe some advanced patterns for promise usage. # Error handling One of the more useful features of promise-based asynchrony is automatic propagation of errors. However, just like traditional exception handling, this feature is only useful if errors are correctly propagated up the call stack until they reach a method that knows how to handle them. Promise-based error handling adds an additional concern in that errors are only passed along explicit promise chains. If you write a...
-
While writing Silon, I had to overcome number of challenges. You can see the full details in the comments & commit history of this repo, and in some cases in [bugs I filed in the LESS compiler](https://github.com/less/less.js/issues?utf8=%E2%9C%93&q=is%3Aissue+author%3ASLaks). Here are some of the more interesting ones. ##Nested XOR As described above, my operation mixins can take either simple selectors or further logical operations as their operand parameters. For the most part, this is simple. For AND operations, I can simply concatenate the parts together using sibling combinators (`~`). For OR operations, I can simply select each operand separately, and the LESS...
-
Last week, Microsoft shocked the development community with [Visual Studio Code](https://code.visualstudio.com), a new lightweight version of Visual Studio with full support for Mac & Linux. However, while Visual Studio Code may look very similar to the original Visual Studio, it's actaully a complete rewrite, with almost nothing in common. This blog post will explore VS Code's architecture in greater depth.
Like many recent products coming from DevDiv (Microsoft's Developer Division), Visual Studio code is built almost entirely on open-source software (VS Code itself is not open source, but it [soon will be](https://twitter.com/khellang/status/593466086705766400)).
-
[Last time](/2015-04-01/typename-comments-a-new-kind-of-comment), I introduced a new syntax for code comments, typename comments. April Fools! However, although I do not intend for anyone to actually write code like this, everything I wrote in that blog post is true; this syntax does work. The reason this technique works is that the letter classes are both contained in and derived from the outer `Scope` class. Because they're contained in the `Scope` class, they are referenced as static members of that class – `Scope.A`. However, like any other static member, they can also be accessed through a qualifier of any class that derives from...
-
C# has two well-known styles of comments: C-style comments (`/* ... */`) and C++-style comments (`// ...`). This blog post introduces a third kind of comment: typename comments. With a bit of supporting code, you can write comments as part of type names – in casts, variable declarations, generic parameters, and anywhere else a typename can occur. Typename comments are type expressions that precede any type that you define, like this: ```csharp partial class Scope { interface IPlayer { void PlayAgainst(M.u.s.t.B.e.A.n.N.P.C.IPlayer other); List FindDefeatedOpponents(); } class Player : IPlayer { W.i.l.l.B.e.R.e.s.e.t.A.t.E.a.c.h.L.e.v.e.l.Player opponent = null; readonly List pastOpponents = new List();...
-
How many times have you seen code like this? ```csharp if (someSequence.Count() > 2) { } ``` LINQ's [`.Count()` method](https://msdn.microsoft.com/en-us/library/vstudio/bb338038() has an important performance subtlety which can make this code unnecessarily slow. The root of the problem is that the `IEnumerable` interface, which all LINQ methods operate on, doesn't actually have a count (if it did, there would be no need for the `Count()` extension method in the first place). Therefore, the `Count()` method is actually O(n), looping through the entire collection to count every item. Fortunately, the implementation of `Count()` is a bit smarter than this. As you can...
-
[Last time](/2015-01-05/introducing-promises), I explained what promises are and how they work. Now, I'll explore standard & third-party promise libraries in popular languages, explaining how they implement each facet of the promise paradigm. # .Net languages (C#, VB, etc...) The .Net base class library includes promise classes called [`Task`](https://msdn.microsoft.com/en-us/library/system.threading.tasks.task) and [`Task`](https://msdn.microsoft.com/en-us/library/dd321424). These classes were introduced in .Net 4.0, released in 2010. `Task` is used for promises which have no value (simply running callbacks once the operation is complete); `Task` inherits `Task` and exposes a value as well. ## Methods - The then() method, which adds a callback to the promise, is...
-
[Last time](/2015-01-04/async-method-patterns), I explored the two main options for writing asynchronous functions. Now, I'll describe promises in more depth. The concept of a promise can be implemented in any language; the sample code is in Javascript, running in a Node-like environment. Part 4 will describe the details promise frameworks in various other languages. # Basics A promise is an object that stores an asynchronously-computed value, or an error. The only way to consume the promise's value (or error) is to pass it a callback by calling `then()` (some frameworks have different names for the method). A promise is always in...
-
[Last time](/2014-12-23/parallelism-async-threading-explained), I explained the basic concepts of asynchronous and multi-threaded programming. As I explained there, the most efficient way to run non-CPU-bound operations concurrently is to call them asynchronously. However, asynchronous code can be confusing and difficult to work with. This post will explain different techniques for writing asynchronous functions. The concepts described in this post apply to all languages; the sample code is in Javascript, running in a Node-like environment. # The problem An asynchronous method cannot simply return its value like any other method. Since the result is computed asynchronously, the method will have already returned before...
-
Concurrent programming techniques, such as multi-threading or asynchronous operations, are all the rage nowadays. As Moore's law begins to fail, the industry is turning to concurrency to deliver the next generation of performance boosts. Every hot new development framework makes some kind of claim to run efficient asynchronous or multi-threaded code. With all of this hype, however, it's easy to get confused about the exact meanings of “multi-threading”, “parallelism”, and “asynchrony”, and the difference between them. # About asynchrony An asynchronous operation is an operation which continues in the background after being initiated, without forcing the caller to wait for...
-
# Background Both Visual Studio and Roslyn use the [Managed Extensibility Framework](https://mef.codeplex.com/) (MEF) to build large applications out of decoupled, extensible components. MEF allows different parts of these programs to talk to each-other using clearly defined interfaces, allowing different subsystems to be developed by different teams on different release cycles without breaking anything. MEF is also used for extensibility. Visual Studio uses MEF to import services like syntax highlighting, IntelliSense providers, and other editor services; Roslyn uses MEF to import refactorings and diagnostics. This allows you to `[Export]` these services in your own extensions, and have Visual Studio or Roslyn...
-
Visual Studio 2010 rewrote the entire shell UI – the MDI tabs & tool windows, the toolbars, and the menus – in WPF. This let it use WPF's powerful resources / theming system to style all of the UI elements, which Microsoft took advantage of in VS 2012 to add multiple themes (Light, Dark, and, later, Blue). This blog post will explore how this system is implemented. Later blog posts will explain how to use VS theme colors & controls in your own VS extensions, and, later, how to use VS theming directly in your own standalone application (which will...
-
As I've described [earlier]({% post_url 2013-11-10-extending-visual-studio-part-2-core-concepts %}), when creating a Visual Studio extension, you are given a choice between the older VsPackage-style extension (using a wizard from the New Project dialog) and the newer, MEF-based extensions. Newer parts of VS, such as the editor, the Web Tools, or Roslyn, are built using MEF, so an extension simply needs to export MEF services for these components to import & run. These MEF-based extensions are much simpler and easier to work with. However, if you create an MEF-based extension (eg, from a Roslyn or editor extension template), there is no obvious way...
-
[Last time]({% post_url 2014-05-21-exploring-roslyn-part-2-inside-end-user-preview %}), I talked about what the Roslyn End-User Preview does and how it works. This time, I'll talk about some subtle breaking changes in the compiler. The C# & VB teams have a very high bar for backwards compatibility; they try extremely hard to make sure that all of your existing code will compile identically in Roslyn. However, in any project as large as a compiler, there are bound to be some changes in the way compilation works. Some of these are flaws in the old compiler, for which Roslyn's fixes can subtly break existing code;...
-
[Last time]({% post_url 2014-04-07-exploring-roslyn-part-1-introduction %}), I described the basics of the Roslyn compiler platform, including how the different layers are built and interact with each-other. In this post, I'll talk about what the End-User Preview does and how it works. The Roslyn End-User Preview provides the first peek at the new Visual Studio managed editing & debugging experience, powered by Roslyn. The preview completely replaces all of the native language services (the old DLLs will not be loaded at all) with the new Roslyn-powered versions. These new DLLs are written entirely in C# and VB (except for a small C++...
-
The .Net Compiler Platform, codenamed "Roslyn", is the most ambitious project from Microsoft's Developer Division in recent years. The C# and VB teams got together and rewrote the compilers and language services from scratch in managed code (a mix of C# and VB), replacing a horrible mess of C++ code (with some managed code) that had mutated over the past ten years into a complex and difficult-to-modify codebase. Now, after over five years of work, Roslyn is almost finished, and is an integral part of Visual Studio 2015, [now available in preview](https://www.visualstudio.com/news/vs2015-vs). # Why rewrite everything? - The native compilers...
-
Errors are one of the most common and annoying problems in programming. Whether it's the parser, the compiler, the type system, the runtime, or even system memory, everything you work with seems to have some way of complaining to you and refusing to run your code. Programmers spend more time fixing errors than any other task when developing applications [citation needed]. But what if you could program without any errors? To avoid these troublesome errors, I am proud to present a new language called **ErrorFree**. This language cannot have any errors, anywhere. In fact, every possible file, of any length,...
-
After four exciting years, I am regretfully leaving the [Microsoft MVP program](https://mvp.microsoft.com/). I have greatly enjoyed meeting and interacting with the Roslyn team, as well as the other C# & VB MVPs, and I hope to be able to keep up these connections at technical conferences. I've also savored the unique opportunity to discuss the future of C# and Visual Studio with the development teams at Microsoft, especially as new versions of these products are developed (I've filed over 150 bugs through the program). In brighter news, I'm proud to announce that I've been hired by Google, working within the...
-
[Last time]({% post_url 2014-02-25-extending-visual-studio-part-4-writing-cross-version-extensions %}), I talked about how to write Visual Studio extensions that work in multiple versions of Visual Studio, using the built-in assembly redirects. Using unversioned assemblies is trickier. The most straightforward approach is to release a separate VSIX extension for each version of Visual Studio. This is the approach taken by [Web Essentials](http://vswebessentials.com/), especially because it tends to be very tightly coupled to version-specific features within the web tools assemblies. However, this makes it much more annoying to maintain the separate codebases. An alternative approach, [taken by VsVim](https://github.com/jaredpar/VsVim/tree/master/Src/VsSpecific), is to put all code that uses unversioned...
-
[Last time]({% post_url 2014-02-21-extending-visual-studio-part-3-assembly-versioning %}), I talked about the different approaches that Visual Studio takes toward assembly versioning. Navigating this mess and producing a version-independent VSIX requires careful planning. The first step is to pick a minimum version of Visual Studio that you want to support. Your extension cannot use features or APIs that were introduced after this version. For most extensions, the minimum version would be VS2010, which introduced both the VSIX extension manager and the new WPF editor. However, if you want to extend newer features, such as Peek, the new CSS or HTMLX editors, or Roslyn, you...
-
The new [.Net Reference Source Browser](https://referencesource.microsoft.com/) (see my [previous post]({% post_url 2014-02-24-inside-the-new-net-reference-source %})) is an excellent example of one of the less-obvious uses of the new [Roslyn](https://msdn.com/roslyn) toolchain. [Kirill Osenkov](https://twitter.com/KirillOsenkov) used Roslyn to recreate Visual Studio's source browser experience in a standalone webapp, allowing people to browse the .Net Reference Source from anywhere. In this post, I will explore how this app is implemented. The source browser is generated by a conversion tool that uses Roslyn to parse every source file in the codebase and generate a massive collection of HTML files comprising the full browser. Almost all of the...
-
Seven years ago, Microsoft released the .Net Reference Source Code, containing source for much of the .Net BCL for use with debugging. You could configure Visual Studio to use Microsoft's public symbols servers, then step into the actual source code of .Net methods and see what's going on under the hood. While this was, in theory, extremely useful, it had a number of limitations that made it far less useful. A number of the source files were blank, or simply missing entirely. The source code had been filtered by a poorly-made scrubber to remove all employee names, including those in...
-
[Last time]({% post_url 2013-11-10-extending-visual-studio-part-2-core-concepts %}), I talked about the core concepts and basic assemblies within Visual Studio that are used to create extensions. This time, I'll talk about how Microsoft manages these assemblies across Visual Studio. One of the complex aspects of writing Visual Studio extensions is dealing with versioning issues. Each release of Visual Studio changes the major version of all of the VS DLLs. Without some kind of work around, VS extensions would need a separate project for each version of Visual Studio, so that it can reference the correct versions of the VS DLLs. Visual Studio takes...
-
When using Visual Studio, it can ocasionally be useful to have separate “profiles” – to be able to start multiple instances of Visual Studio with independent settings. For example, if you work on multiple projects that use very different source formatting settings, you can create a separate profile for each one, allowing you to open each project with the correct settings. If you create books or blog posts that have screenshots of Visual Studio, you can create a separate profile with pristine settings and no extensions installed, so that you can create screenshots that match the out-of-box experience. Visual Studio...
-
One of Gmail's many useful features is "Send mail as", which lets you use a single Gmail account to send emails from multiple email addresses. Especially when combined with email forwarding, this is a great way to manage multiple email accounts from a single Gmail tab. By default, this feature will send the email from Gmail's regular SMTP servers, including your actual email address in the `Sender` header to indicate the original sender of the email (without that, the email would be rejected as spam, since it isn't coming from the correct SMTP servers for that domain). To avoid this,...
-
.Net's [assembly resolver](https://msdn.microsoft.com/en-us/library/yx7xezcf) (Fusion) takes assembly names (eg, `MyCompany.MyProduct, Version=2.1.0.0, , Culture=neutral, PublicKeyToken=3bf5f017df1a30a5`) and resolves them to actual DLL files, searching in the Global Assembly Cache, the folder containing the entry assembly, and any additional PrivateBinPaths registered for the AppDomain. You can change the way it resolves specific assemblies using `` tags in your App.config (or Web.config) file, giving it a different name to use instead if it tries to resolve a specific range of versions for an assembly. This is useful if you want to support references to multiple versions of the same assembly (eg, from older plugins), but...
-
After over two months of work, I rewrote the Markdown editor in [Web Essentials](http://vswebessentials.com/) to support syntax highlighting & IntelliSense for embedded code blocks. If you add a GitHub-style [fenced code block](https://help.github.com/articles/github-flavored-markdown#syntax-highlighting) with a language identifier, Visual Studio will now provide full language services within that code block. You get the full editing experience you're used to in Visual Studio, including syntax highlighting, IntelliSense, outlining, error checking, code snippets, and Peek Definition. 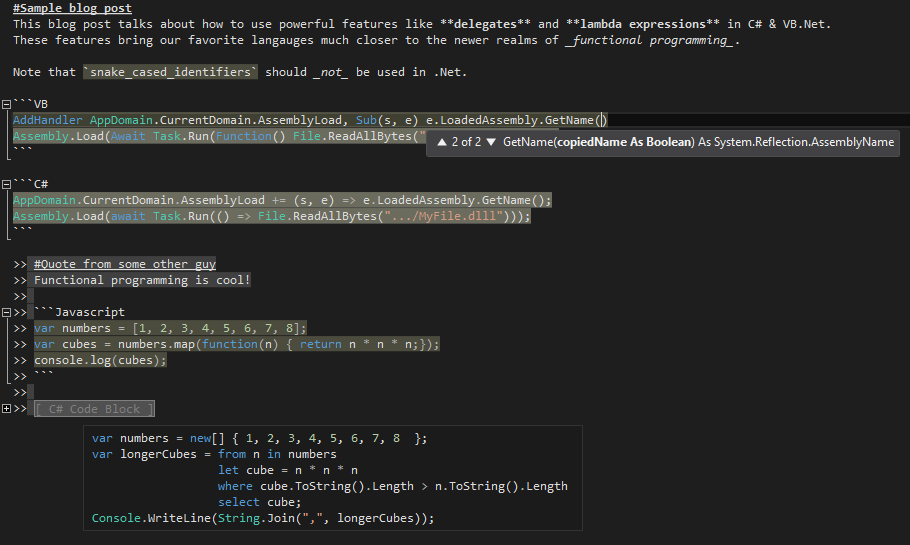 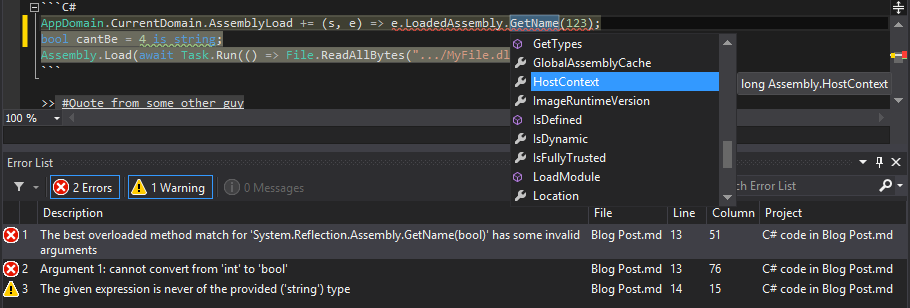 This is perfect for writing Readmes or documentation for open-source projects on GitHub, or for any other Markdown files you may...
-
Some interfaces have events that most implementations will never raise. For example, the WPF `ICommand` interface has a `CanExecuteChanged` event that should be raised when the command becomes enabled or disabled. Most commands are always enabled, so this event is no needed. However, the interface still requires you to implement this event. Thus, most `ICommand` implementations will look something like this: ```csharp class MyCommand : ICommand { public bool CanExecute(object parameter) { return true; } public event EventHandler CanExecuteChanged; public void Execute(object parameter) { ... } } ``` This will generate a compiler warning, "The event 'MyCommand.CanExecuteChanged' is never used"....
-
[My previous post]({% post_url 2013-10-18-extending-visual-studio-part-1-getting-started %}) described how to get started writing Visual Studio extensions. This post will introduce the basic concepts needed to work with Visual Studio's extensibility APIs. # Creating an extension The Visual Studio SDK includes a number of templates for creating extensions. Which template you use depends on what parts of Visual Studio you want to extend. ## Editor Extensions If you only want to extend the new WPF editor, you can create an editor extension. Editor extensions allow you to add or change features (IntelliSense, highlighting, etc) for existing languages that use the new editor,...
-
In addition to being an excellent development environment, Visual Studio also has a powerful extensibility system. In this blog post, I will explain how to start writing Visual Studio extensions, so you can make the IDE work the way you want it to. # Getting Started To use or develop extensions, you need Visual Studio Professional or higher (Express Edition won't work). First, download and install the [Visual Studio SDK](https://www.microsoft.com/visualstudio/eng/downloads#d-vs-sdk) (for VS2012, see [here](https://www.microsoft.com/en-us/download/details.aspx?id=30668); this adds project types for Visual Studio extensions and is required in order to open or create any extension. Next, you need to decide whether to...
-
.Net has three low-level mechanisms to run code in parallel: `Thread`, `ThreadPool`, and `Task`. These three mechanism serve different purposes. # Thread `Thread` represents an actual OS-level thread, with its own stack and kernel resources. (technically, a CLR implementation could use fibers instead, but no existing CLR does this) `Thread` allows the highest degree of control; you can `Abort()` or `Suspend()` or `Resume()` a thread (though this is a very bad idea), you can observe its state, and you can set thread-level properties like the stack size, apartment state, or culture. The problem with `Thread` is that OS threads are...
-
One of the less-documented features of the [LESS language](http://lesscss.org) is the ampersand selector, which refers to the parent selector inside a nested selector. The ampersand selector is most commonly used when applying a modifying class or pseudo-class to an existing selector: ```scss a { color: blue; &:hover { color: green; } } ``` The inner selector in this example compiles to `a:hover`. Without the `&`, it would compile to `a :hover` (a descendant selector that matches hovered elements inside of `` tags), which is not what the author intended. However, `&` has a variety of other uses. # Changing state...
-
_Javasript is not a traditionally object-oriented programming languague_. Wikipedia [describes Javascript](https://en.wikipedia.org/wiki/Javascript) as a ”scripting, object-oriented (prototype-based), imperative, functional“ language. However, since most developers prefer to use classical (pun intended) object-oriented patterns, people have come up with ways to use Javascript with traditional OOP techniques, including classes and inheritance. Most Javascript developers are by now familiar with the standard technique for Javascript classes. For example: ```js function Animal(name) { this.name = name; this.legs = [ new Leg("LF"), new Leg("RF"), new Leg("LB"), new Leg("RB") ]; } Animal.prototype.summon = function() { ttsEngine.speak(this.name); }; Animal.prototype.walk = function() { // Complicated code involving this.legs() };...
-
{% assign openTag = '{%' %} After upgrading to Jekyll 1.1, you may notice that posts that used to work fine now give an error like `tag was never closed`. These errors can appear for no apparent reason; the tags will appear to be correctly closed. This error occurs if the first blank line in the post is inside a Jekyll block (eg, `{{ openTag }} raw %}` or `{{ openTag }} highlight %}`). The bug is caused by a change in Jekyll's post excerpt support. As of version 1.0, Jekyll creates an [excerpt](https://github.com/mojombo/jekyll/issues/837) for every post in your site,...
-
As I mentioned [last time]({% post_url 2013-07-22-thread-safe-data-structures %}), the best way to create simple thread-safe lock-free data structures is with compare-and-swap loops. To recap, this technique works as follows: > 1. Fetch the current value of the field into a local variable > 2. Run your actual logic to generate a new immutable object based on the current value (eg, push an item onto an immutable stack) > 3. Use the atomic [compare-and-swap](https://en.wikipedia.org/wiki/Compare-and-swap) operation to set the field to the new value if and only if no other thread has changed it since step 1. > 4. If a different...
-
[Last time]({% post_url 2013-06-23-creating-immutable-stack %}), I showed how to create a simple [covariant]({% post_url 2013-06-28-covariant-immutable-stack %}) immutable stack. One of the biggest attractions of immutable types is the ease with which they can be used to write thread-safe code. However, in the real world, things usually need to mutate. How can this be done safely? For an object to be safe, it must not be possible to observe it in an inconsistent state (as long as you follow its documented rules). For example, it should not be possible to see a collection with a hole in it from the middle...
-
[Last time]({% post_url 2013-06-23-creating-immutable-stack %}), I showed how to create a simple immutable stack. However, this stack is not [covariant](https://msdn.microsoft.com/en-us/library/dd799517.aspx). Ideally, we should be able (for example) to implicitly convert `IStack` to `IStack`. Most collection types cannot be co-variant. Had `List` been convertible to `List`, you would then be able to add an `int` (or any other type) to the converted `List`, even though it can't fit in `List` (which the casted instance actually is). To be precise, covariance is only type-safe for immutable types. Since our `Stack` class is immutable, we should be able to simply change it to...
-
[Last time]({% post_url 2013-06-11-readonly-vs-immutable %}), I explained the basic meaning of immutability. The simplest useful example of an immutable class is an immutable stack. Immutable stacks work just like regular stacks – with `Push()`, `Pop()`, and `Peek()` methods – except that instead of mutating the original instance, `Push()` and `Pop()` return a new, modified, instance. In code, that looks like ```csharp public interface IStack { IStack Push(T element); IStack Pop(); T Peek(); bool IsEmpty { get; } } IStack myStack = empty; myStack = myStack.Push(1).Push(2).Push(3); while (!myStack.IsEmpty) { Console.WriteLine(myStack.Peek()); myStack = myStack.Pop(); } ``` Each implementation of this interface would...
-
A _read-only_ object is an object that does not expose any way to change it. `ReadOnlyCollection` (returned by `AsReadOnly()`) is a good example). However, `IEnumerable` is also read-only. The important distinction is that read-only objects are allowed to change. If you write `list.Add(new Test())`, your read-only collection (which just wraps `list`) will have changed. Read-only collections are useful for designing safe APIs, where only the owner of the collection is allowed to change it. However, it won't do any good for thread-safety. ----- An **immutable** object is an object that cannot change _at all_, no matter what happens (Reflection doesn't...
-
{% assign openTag = '{%' %} [Last time]({% post_url 2013-06-09-writing-about-jekyll-in-jekyll %}), we saw how to write about Jekyll tags in Jekyll-based blog posts, using HTML entities or the `{{ openTag }} raw %}` block. These techniques cannot be used in syntax-highlighted code blocks (Jekyll's {% higlight %} tag or a Markdown code block), since such blocks are always HTML-escaped. Instead, you can wrap all of the code in the block with a Liquid {% raw %} tag. Since the Liquid tag is processed before Markdown or syntax highlighting, this works perfectly. ```liquid {% raw %} {% raw %} Liquid uses...
-
[Jekyll](https://jekyllrb.com) is a very nice system for writing blogs. However, it does have some shortcomings, particularly in the Liquid templating engine. In this post, I will talk about how to write about Liquid tags within a Liquid file (such as a Jekyll blog post). The problem is that writing Liquid syntax such as tags or variables in the content will cause Liquid to interpret them as commands, and break evertything. This problem can occur when writing a blog post about Liquid itself (such as this one), or when writing a blog post about code that generates Liquid markup (like I...
-
The next step in [migrating my blog to Jekyll]({% post_url 2013-05-31-migrating-from-blogger-to-jekyll %}) was to convert the code blocks to use Jekyll's {% highlight %} tag. Since Blogger has no support for server-side syntax highlighting, all of the code blocks in my HTML are implemented as `...`, with HTML-escaped code inside the tag. (the class name is used by [SyntaxHighlighter](https://alexgorbatchev.com/SyntaxHighlighter/)) I needed to convert that to Liquid tags with raw (non-escaped) code inside of them. To do this, I wrote a small C# script: {% assign openTag = '{%' %}{% comment %} The only way to embed the endraw tag (which...
-
The first step in my migration to Jekyll was to import my old posts into the Jekyll site. To do this, I used [blogger2jekyll](https://github.com/coolaj86/blogger2jekyll), a wonderful open-source Node.js script that does exactly that. Using this tool is very simple. First, log into Blogger's admin panel, got to Settings, Other, and click Export blog to download a giant XML file with all of your posts. Next, install and run the script: (you'll need to install [Node.js](https://nodejs.org) first) ```bash npm install -g blogger2jekyll blogger2jekyll /path/to/blog-dd-mm-yyyy.xml ./_posts ``` If you aren't running it from the directory containing your Jekyll site, you'll need to...
-
My new design is powered by Jekyll and LESS (the LESS does as much or more as the Jekyll). When implementing the design, I had the following goals in mind: - No costs - I use GitHub Pages for completely free hosting (other than the cost of the domain name) - This means that I cannot use Octopress or Jekyll plugins - No build step - I want to be able to edit posts from anywhere, without having to install Ruby or Grunt.js and run any kind of build process before pushing - I do use pre-compiled LESS, since Jekyll...
-
After nearly a year of inactivity, I have finally returned to my blog. I had neglected it for so long primarily because I don't like Blogger's compose options. After spending so much time on StackOverflow and GitHub, I find Markdown far more convenient than Windows Live Writer or Blogger's compose window, especially when writing about code. I also was never very happy with the design I originally created, and doing raw HTML / CSS design in Blogger is painful. To solve these problems, I just finished porting my blog to [Jekyll](https://jekyllrb.com) on [GitHub Pages](https://pages.github.com/). Now that I can write posts...
-
{% raw %} If you open an older ASP.Net MVC3 project in Visual Studio 2012, you may see lots of errors in the Razor views, along the lines of “The name 'model' does not exist in the current context”, and similar errors whenever you try to use MVC features like HTML helpers or ViewContext (eg, “System.Web.WebPages.Html.HtmlHelper does not contain a definition for TextBoxFor”). This happens if there is no <add key="webpages:Version" value="1.0" /> in the <appSettings> element in Web.config. Without this element, Visual Studio will assume that you’re using the latest version of Razor and the WebPages framework. Until VS2012,...
-
{% raw %} Last year, Microsoft announced a simple new feature in C# 5: Caller Info Attributes. These attributes let you to create methods with optional parameters and tell the compiler to pass the caller’s filepath, line number, or member name instead of the parameter’s default value. This allows you to create logging methods that automatically know where they’re being called. When the feature was announced, I wrote a couple of blog posts that delved into some of the corner cases of the new feature. At the time, there was no public implementation, so they were pure conjecture. This morning,...
-
{% raw %} If you use the ASP.Net MVC 3 [Compare] validation attribute on a model property, then include that model as a property in a parent model (so that the field name becomes Parent.ChildProperty), the built-in unobtrusive client validation will choke, and will always report the field as having an error. This is due to a bug on line 288 of jquery.validate.unobtrusive.js: {% endraw %} {% highlight js %} adapters.add("equalto", ["other"], function (options) { var prefix = getModelPrefix(options.element.name), other = options.params.other, fullOtherName = appendModelPrefix(other, prefix), element = $(options.form).find(":input[name=" + fullOtherName + "]")[0]; // Bug setValidationValues(options, "equalTo", element); }); {%...
-
{% raw %} CSRF attacks are one of the many security issues that web developers must defend against. Fortunately, ASP.Net MVC makes it easy to defend against CSRF attacks. Simply slap on [ValidateAntiForgeryToken] to every POST action and include @Html.AntiForgeryToken() in every form, and your forms will be secure against CSRF. However, it is easy to forget to apply [ValidateAntiForgeryToken] to every action. To prevent such mistakes, you can create a unit test that loops through all of your controller actions and makes sure that every [HttpPost] action also has [ValidateAntiForgeryToken]. Since there may be some POST actions that should...
-
{% raw %} What’s wrong with the following code? {% endraw %} {% highlight csharp %} var names = new HashSet(StringComparer.OrdinalIgnoreCase); ... if (names.Contains(sqlCommand.ExecuteScalar()) {% endhighlight %} {% raw %} This code is intended to check whether the result of a SQL query is contained in a case-insensitive collection of names. However, if you run this code, the resulting check will be case-sensitive. Why? As you may have guessed from the title, this is caused by covariance. In fact, this code will not compile at all against .Net 3.5. The problem is that ExecuteScalar() returns object, not string. Therefore, it...
-
{% raw %} One common misconception about web security is that protecting important actions with CAPTCHAs can prevent XSS attacks from doing real damage. By preventing malicious code from scripting critical tasks, the idea goes, XSS injections won’t be able to accomplish much. This idea is dangerously wrong. First of all, this should not even be considered except as a defense-in-depth mechanism. Regardless of whether the actions you care about are protected by CAPTCHAs, XSS attacks can create arbitrary UI on your pages, and can thus make “perfect” phishing attacks. Also, even with CAPTCHAs, an XSS injection can wait until the...
-
{% raw %} One of the most useful additions to the .Net 4.0 base class library is the System.Collections.Concurrent namespace, which contains an all-new set of lock-free thread. However, these collections are noticeably different from their classical counterparts. There is no simple ConcurrentList<T> that you can drop into your code so that it will become thread-safe. Instead, the new namespace has a queue, a stack, and some new thing called a bag, as well as ConcurrentDictionary<TKey, TValue> that largely resembles classical dictionaries. It also has a BlockingCollection<T> class that wraps a concurrent collection and blocks until operations can succeed. Many...
-
{% raw %} ASP.Net MVC uses the new (to ASP.Net 3.5) Http*Base wrapper classes (HttpContextBase, HttpRequestBase, HttpResponseBase, etc) instead of the original Http* classes. This allows you to create mock implementations that inherit the Http*Base classes without an actual HTTP request. This is useful for unit testing, and for overriding standard behaviors (such as route checking). In ordinary MVC code, the HttpContext, Request, and Response properties will return Http*Wrapper instances that directly wrap the original Http* classes (eg, HttpContextWrapper, which wraps HttpContext). Most MVC developers use the HttpContext and related properties without being aware of any of this redirection. Until...
-
{% raw %} People sometimes wonder why C# 5 needs to add caller info attributes, when this information is already available by using the StackTrace class. In reality, caller info attributes behave rather differently from the StackTrace class, for a number of reasons. Advantages to Caller Info Attributes The primary reason to use caller info attributes is that they’re much faster. Stack walking is one of the slowest internal (as opposed to network IO) things you can do in .Net (disclaimer: I haven’t measured). By contrast, caller info attributes have exactly 0 performance penalty. Caller info is resolved at compile-time;...
-
{% raw %} UPDATE: Now that the Visual Studio 11 beta has shipped with this feature implemented, I wrote a separate blog post exploring how it actually behaves in these corner cases. Last time, I explored various pathological code samples in which the [CallerLineNumber] attribute does not have obvious behavior. This time, I’ll cover the last of these new caller info attributes: [CallerMemberName]. The [CallerMemberName] attribute tells the compiler to insert the name of the containing member instead of a parameter’s default value. Unlike [CallerLineNumber] and [CallerFileName], this has no equivalent in C++; since the C / C++ versions of...
-
{% raw %} UPDATE: Now that the Visual Studio 11 beta has shipped with this feature implemented, I wrote a separate blog post exploring how it actually behaves in these corner cases. This is part 2 in a series about C# 5’s new caller info attributes; see the introduction. The [CallerLineNumber] attribute tells the compiler to use the line number of the call site instead of the parameter’s default value. This attribute has more corner cases than [CallerFileName]. In particular, unlike the C preprocessor’s __LINE__ macro, the C# compiler inserts the line number of a parsed method call. Therefore, it...
-
{% raw %} UPDATE: Now that the Visual Studio 11 beta has shipped with this feature implemented, I wrote a separate blog post exploring how it actually behaves in these corner cases. C# 5 is all about asynchronous programming. However, in additional to the new async features, the C# team managed to slip in a much simpler feature: Caller Info Attributes. Since C#’s inception, developers have asked for __LINE__ and __FILE__ macros like those in C and C++. Since C# intentionally does not support macros, these requests have not been answered. Until now. C# 5 adds these features using attributes...
-
{% raw %} One common question about ASP.Net MVC is how to make “default” controller. Most websites will have a Home controller with actions like About, FAQ, Privacy, or similar pages. Ordinarily, these actions can only be accessed through URLs like ~/Home/About. Most people would prefer to put these URLs directly off the root: ~/About, etc. Unfortunately, there is no obvious way to do that in ASP.Net MVC without making a separate route or controller for each action. You cannot simply create a route matching "/{action}" and map it to the Home controller, since such a route would match any...
-
{% raw %} Update: This bug was fixed in XRegExp 1.5.1. However, as far as I know, there are no released versions of SyntaxHighlighter that contain the fix. XRegExp is an open source JavaScript library that provides an augmented, extensible, cross-browser implementation of regular expressions, including support for additional syntax, flags, and methods. It’s used by the popular SyntaxHighlighter script, which is in turn used by many websites (including this blog) to display syntax-highlighted source code on the client. Thus, XRegExp has a rather wide usage base. However, XRegExp conflicts with jQuery. In IE, any page that includes XRegExp and...
-
{% raw %} Part 1 is here Some languages have better ways to pass boolean parameters. C# 4.0, and all versions of VB, allow parameters to be passed by name. This allows us to write much clearer code: {% endraw %} {% highlight csharp %} //C# 4.0: UpdateLayout(doFullLayout: false) {% endhighlight %} {% highlight vbnet %} 'VB.Net: UpdateLayout(doFullLayout:=False) {% endhighlight %} {% raw %} Without requiring any changes to the function definition, this makes the meaning of the true / false abundantly clear at the call-site. Javascript offers another interesting alternative. In Javascript, booleans conditions actually check for “truthyness”. The...
-
{% raw %} Have you ever written code like this: {% endraw %} {% highlight csharp %} public void UpdateLayout(bool doFullLayout) { //Code if (doFullLayout) { //Expensive code } //More code } {% endhighlight %} {% raw %} This pattern is commonly used when some operation has a “cheap” mode and an “expensive” mode. Other code will have calls like UpdateLayout(false) and UpdateLayout(true) scattered throughout. The problem is that this isn’t very obvious for people who aren’t familiar with the codebase. If you take a look at a file you’ve never seen before and see calls like UpdateLayout(false) and UpdateLayout(true)...
-
{% raw %} C# is usually touted as a type-safe language. However, it is not actually fully type-safe! To examine this claim, we must first provide a strict definition of type-safety. Wikipedia says: In computer science, type safety is the extent to which a programming language discourages or prevents type errors. A type error is erroneous or undesirable program behavior caused by a discrepancy between differing data types. To translate this to C#, full type-safety means that any expression that compiles is guaranteed to work at runtime, without causing any invalid cast errors. Obviously, the cast (and as) operator is an...
-
{% raw %} Until now, I've been focusing on only one of the differences between delegates and function pointers; namely, associated state. Delegates have one other capability that function pointers do not. A single function pointer can only point to one function. .Net, on the other hand, supports multicast delegates – delegates that point to multiple functions. You can combine two existing delegates using the + operator (or by calling Delegate.Combine) to create a single new delegate instance that points two all of the methods in the original two delegates. This new delegate stores all of the methods from the...
-
This post
-
A .Net event actually consists of a pair of accessor methods named add_EventName and remove_EventName. These functions each take a handler delegate, and are expected to add or remove that delegate from the list of event handlers. In C#, writing public event EventHandler EventName; creates a field-like event. The compiler will automatically generate a private backing field (also a delegate), along with thread-safe accessor methods that add and remove handlers from the backing field (like an auto-implemented property). Within the class that declared the event, EventName refers to this private backing field. Thus, writing EventName(...) in the class calls this...
-
Sometimes, it can be useful to make an extension method specifically for a single block of code. Unfortunately, since extension methods cannot appear in nested classes, there is no obvious way to do that. Instead, you can create a child namespace containing the extension method. In order to limit the extension method’s visibility to a single method, you can put that method in a separate namespace block. This way, you can add a using statement to that namespace alone. For example: namespace Company.Project { partial class MyClass { ... } } namespace Company.Project { using MyClassExtensions; namespace MyClassExtensions { static...
-
Unlike WinForms or native Win32 development, WPF provides a rich layout model which allows developers to easily create complicated UIs that resize to fit their contents or the parent window. However, when developing custom controls, it can be necessary to layout child controls manually by overriding the MeasureOverride and ArrangeOverride methods. To quote MSDN, Measure allows a component to determine how much size it would like to take. This is a separate phase from Arrange because there are many situations where a parent element will ask a child to measure several times to determine its optimal position and size. The...
-
This is part 5 in a series about state and function pointers; part 1 is here. Last time, we saw how C# 2 supports closures by compiling anonymous functions into member functions of a special class that holds local state from the outer function. Unlike the languages we’ve looked at before, Javascript has had closures baked in to the languages since its inception. My standard example can be achieved very simply in Javascript: var x = 2; var numbers = [ 1, 2, 3, 4 ]; var hugeNumbers = numbers.filter(function(n) { return n > x; }); This code uses the...
-
This is part 4 in a series about state and function pointers; part 1 is here. Last time, we saw that it is possible to pass local state with a delegate in C#. However, it involves lots of repetitive single-use classes, leading to ugly code. To alleviate this tedious task, C# 2 supports anonymous methods, which allow you to embed a function inside another function. This makes my standard example much simpler: //C# 2.0 int x = 2; int[] numbers = { 1, 2, 3, 4 }; int[] hugeNumbers = Array.FindAll( numbers, delegate(int n) { return n > x; }...
-
.Net supports two kinds of delegates: Open delegates and closed delegates. When you create a delegate that points to an instance method, the instance that you created it from is stored in the delegate’s Target property. This property is passed as the first parameter to the method that the delegate points to. For instance methods, this is the implicit this parameter; for static methods, it's the method's first parameter. These are called closed delegates, because they close over the first parameter and bring it into the delegate instance. It is also possible to create open delegates which do not pass...
-
This is part 3 in a series about state and function pointers; part 1 is here. Last time, we saw that it is impossible to bundle context along with a function pointer in C. In C#, it is possible to fully achieve my standard example. In order to explain how this works behind the scenes, I will limit this post to C# 1.0 and not use a lambda expression. This also means no LINQ, generics, or extension methods, so I will, once again, need to write the filter method myself. delegate bool IntFilter(int num); static ArrayList Filter(IEnumerable source, IntFilter filter)...
-
This is part 2 in a series about state and function pointers; part 1 is here. Unlike most other languages, it is not possible to include any form of state in a function pointer in C. Therefore, it is impossible to fully implement closures in C without the cooperation of the call-site and/or the compiler. To illustrate what this means in practice, I will refer to my standard example, using a filter function to find all elements in an array that are greater than x. Since C doesn’t have any such function, I’ll write one myself, inspired by qsort: void*...
-
Most languages – with the unfortunate exception of Java – allow functions to be passed around as variables. C has function pointers, .Net has delegates, and Javascript and most functional programming languages treat functions as first class objects. There is a fundamental difference between C-style function pointers vs. delegates or function objects. Pure function pointers cannot hold any state other than the function itself. In contrast, delegates and function objects do store additional state that the function can use. To illustrate this difference, I will use a simple example. Most programming environments have a filter function that takes a collection...
-
Many people write ForEach extension methods for MVC WebForms views, which take a sequence and a delegate to turn each item in the sequence into HTML. For example: public static void ForEach<T>(this HtmlHelper html, IEnumerable<T> set, Action<T> htmlWriter) { foreach (var item in set) { htmlWriter(item); } } (The unused html parameter allows it to be called as an extension method like other HTML helpers) This code can be called like this: <ul> <% Html.ForEach( Enumerable.Range(1, 10), item => { %> <li><%= item %></li> <% } ); %> </ul> This code creates a lambda expression that writes markup to the...
-
Razor’s inline helpers allow you to create lambda expression that return markup (as a HelperResult). However, there is no simple way to create a lambda expression that writes HTML directly to the page (instead of returning it). In ASPX pages, one can simply put the beginning and end of a lambda expression in expression blocks, then put markup in the middle. For example, this code creates a delegate that writes a <b> tag to the page: <% Action pageWriter = () => {%><b>I'm from a lambda!</b><%}; pageWriter(); pageWriter(); pageWriter(); %> Calling the pageWriter delegate will write directly to the HTTP...
-
In addition to normal and static helpers, Razor supports inline helpers, (also known as templates), which allow you to create lambda expressions that return markup. An inline helper is created by writing @<tag>Content</tag> as an expression. This creates a lambda expression that takes a parameter called item and returns a HelperResult object containing the markup. Inline helpers are used to create functions that take markup as parameters. For example, you might make an IfLoggedOn helper that displays content if there is a logged-in user, but shows a login link to anonymous users. To pass the content to the helper, you...
-
Razor helpers can be extremely useful, but they are designed to be used only by the page that created them. To create reusable helpers, you can create CSHTML pages in the App_Code directory. The WebRazorHostFactory will check for pages in App_Code and create a WebCodeRazorHost instead of the normal WebPageRazorHost. This happens before the virtual CreateHost method; in order to change this behavior, one must create an inherited RazorBuildProvider and override the CreateHost method; for more details, see the source for more details. The WebCodeRazorHost compiles helper methods as public static methods by setting the RazorEngineHost.StaticHelpers property to true. It...
-
The Boot Camp drivers in the latest generation of MacBook Pros now expose more of the laptop’s hardware to Windows. This means that Windows can now adjust the screen brightness in the Windows Mobility Center, and when you plug in or unplug the laptop. The new drivers also expose the laptop’s ambient light sensor via Windows 7’s sensor platform, allowing the screen brightness to be adjusted automatically, and allowing 3rd-party programs to read the brightness.
-
We’ll continue our trek into Razor’s class-level features with helpers. Helpers are one of Razor’s unique features. They encapsulate blocks of HTML and server-side logic into reusable page-level methods. You can define a helper by writing @helper MethodName(parameters) { ... }. Inside the code block, you can put any markup or server-side code. The contents of a helper are parsed as a code block (like the contents of a loop or if block), so any non-HTML-like markup must be surrounded by <text> tags or prefixed by the @: escape. Here is a simple example: <!DOCTYPE html> <html> <body> @helper NumberRow(int...
-
After looking at how Razor’s Execute() method is generated, we will turn to class-level features. C# Razor pages can define class members inside of @functions { ... } blocks. These are Razor’s equivalent of <script runat="server"> blocks in ASPX pages. VBHTML pages use @Functions ... End Functions instead. Functions blocks are emitted directly into top of the generated class, regardless of their location in the original source. Unlike code blocks, function blocks cannot contain markup. Here is a simple example: <!DOCTYPE html> <html> <body> @functions{ public int GetPageLength() { //Don't try this in production. return ((StringWriter)this.Output).ToString().Length; } } @GetPageLength() characters...
-
Last time, we saw how basic Razor constructs are translated into C#. We can see the generated class by adding @{ #error } to the page source. This creates a compiler error in the Execute method, and the resulting Yellow Screen of Death contains a Show Complete Compilation Source: link which will show the generated C# class. Let’s start with a very simple page: <!DOCTYPE html> <html> <body> 1 + 2 = @(1 + 2)<br /> @{ var source = "<b>bold & fancy</b>"; } <code>@source</code> is rendered as @(new HtmlString(source)) </body> </html> @{ #error } This page is rendered like...
-
After looking at the various assemblies in the WebPages framework, we will drill into the inner workings of Razor pages. Razor Side An ordinary CSHTML page is transformed into a class which inherits the WebPage class. The generator overrides the abstract Execute() method from the to render the page to the HTTP response stream. Except for class-level directives and constructs (which will be discussed later), all ordinary content in a Razor page end up in the Execute method. There are three types of normal content: Literals, Code Blocks, and Code Nuggets. Literals include any normal text. Razor compiles literal text...
-
Last time, we saw how standalone Razor pages are served. MVC3 maintains the strict separation between the WebPages framework and the Razor engine.1 Razor Side Like the WebPages framework, MVC3 interacts with Razor indirectly, by relying on RazorBuildProvider from System.Web.WebPages.Razor.dll. However, MVC3 requires that Razor views inherit its own base class, System.Web.Mvc.WebViewPage. MVC3 adds a new @model directive, which can be used instead of @inherits to specify a strongly-typed model. This syntax is implemented by customized RazorCodeParsers and RazorCodeLanguages in the System.Web.MVC.Razor namespaces. These classes are invoked by MvcRazorEngineHosts from a custom RazorHostFactory registered in Views/Web.Config: <system.web.webPages.razor> <host factoryType="System.Web.Mvc.MvcWebRazorHostFactory, System.Web.Mvc,...
-
Last time, we saw that ASP.Net Web Pages are implemented in two independent assemblies. These assemblies are not directly connected to each-other. Razor Side System.Web.WebPages.Razor.dll contains the RazorBuildProvider class, which allows ASP.Net’s build system to compile Razor pages. This class uses a WebRazorHostFactory to create WebPageRazorHosts used to process CSHTML (or VBHTML) files into CodeDOM trees. It compiles the CodeDOM tree and returns the generated type(which will typically inherit System.Web.WebPages.WebPage) to the build system. WebPageRazorHost is coupled to the WebPages framework; it handles the non-standard base types for special pages (StartPage and ApplicationStartPage). RazorBuildProvider can be configured to use a...
-
Razor involves two distinct components: The Razor engine and the WebPages framework. The Razor engine, in System.Web.Razor.dll, parses CSHTML (and VBHTML) files into CodeDOM trees. Except for the word Web in project name, the engine has nothing to do with ASP.Net; it doesn’t even reference System.Web.dll. In fact, it targets the .Net Client Profile, and only references mscorlib and System.dll. The Razor engine is aware of all of Razor’s syntax-level features (code nuggets, sections, helpers), but is not aware of what they mean; it blindly transforms them into function calls. The Razor engine can be used without ASP.Net for any...
-
jQuery makes it very easy to modify a DOM tree. For example, to strip all hyperlinks (<a> tags) from an element, we can write (demo) $(...).find('a[href]') .replaceWith(function() { return this.childNodes }); After getting used to this, one might want to use jQuery to modify HTML contained in a string. Here, however, the naïve approach does not work: var htmlSource = ...; $(htmlSource).find('a[href]') .replaceWith(function() { return this.childNodes }); This code tries to remove all <a> tags from the HTML contained in the htmlSource string. However, what it actually does is create a detached DOM tree containing the new elements, strip all...
-
Last time, we saw that there are severe limitations in creating ASPX pages which inherit generic base classes. Many readers were probably wondering how ASP.Net MVC works around this limitation. In ASP.Net MVC views, people write pages like this all the time: <%@ Page Language="C#" Inherits="ViewPage<IEnumerable<DataLayer.Product>>" %> ASP.Net MVC includes its own workaround for these limitations. The Web.config file in the Views folder of an ASP.Net MVC project registers a PageParserFilter: <pages validateRequest="false" pageParserFilterType="System.Web.Mvc.ViewTypeParserFilter, System.Web.Mvc, Version=3.0.0.0, Culture=neutral, PublicKeyToken=31BF3856AD364E35" ...> ... </pages> PageParserFilter is one of ASP.Net’s lesser-known extensibility points. It can intercept different parts in the parsing process for an...
-
ASP.Net pages can inherit from custom classes (as long as they inherit System.Web.UI.Page). This can be useful to add utility functions or shared (code-behind) behaviors to your pages. (Note that you could also use Extension methods or HTTP modules) However, if you try to inherit a generic base class, it won’t work: public class DataPage<T> : Page { public T Data { get; set; } } <%@ Page Language="C#" Inherits="DataPage<string>" %> This code results in a yellow screen of death, with the parser error, Could not load type 'DataPage<string>'. This happens because the ASP.Net page parser is unaware of C#...
-
.Net developers frequently need to build connection strings, especially when connecting to Access or Excel files using OleDB. Code like the following has been written countless times: //Bad code! Do not use! string conn = "Data Source=" + openFileDialog1.FileName + "; " + "Provider=Microsoft.Jet.OLEDB.4.0;" + "Extended Properties=\"Excel 8.0\""; This code looks innocuous at first glance, but will not work for all filenames. If the filename contains characters like ', ", ;, or =, this code will create an invalid connection string and throw an exception. The correct way to build connection strings is to use one of the DbConnectionStringBuilder classes. ...
-
One of the unique features of ASP.Net WebPages (formerly Razor) is automatic HTML encoding. All strings printed by embedded code nuggets (@ blocks) are automatically HTML-encoded. In addition to this feature, Razor also includes the Html.Encode method, probably copied from ASP.Net MVC. Calling this method naively leads to a nasty surprise – the string will be double-encoded! To see why, look more closely at a typical call: @Html.Encode("<text>"). This Razor markup will call Html.Encode, which returns the string "<text>". Since it returns a string and not an IHtmlString, the Razor engine will encode it again, and render &lt;text&gt;. Careful thought...
-
C# 4.0 adds support for optional parameters. The following code prints 4: static void Main() { TestMethod(); } static void TestMethod(int i = 4) { Console.WriteLine(i); } Optional parameters are a compiler feature. The compiler will emit a normal method with the IL [opt] attribute and a .param declaration that includes a default value: .method hidebysig static void TestMethod([opt] int32 i) cil managed { .param [1] = int32(4) .maxstack 8 L_0001: ldarg.0 L_0002: call void [mscorlib]System.Console::WriteLine(int32) L_0007: ret } Earlier versions of the C# compiler will ignore this metadata. Therefore, you can call such methods in earlier versions of C#,...
-
The new ASP.Net WebPages view engine (formerly Razor) allows you to create reusable parameterized blocks of HTML called helpers. For example: @helper Fibonacci(int count) { int current = 1, prev = 0; for (int i = 0; i < count; i++) { @:@current, int t = current; current += prev; prev = t; } } This helper will write out the first count Fibonacci numbers. It can be called by writing @Fibonacci(30) in the page that defines the helper. Using Razor syntax in this code looks strange. Razor syntax is designed to write HTML tags. Since I’m printing plain text,...
-
.Net DataTables can be very useful when writing data-driven applications. However, they have one limitation: There is no obvious way to databind a grid (or other control) to an arbitrary list of datarows from a table. You can bind to an entire table directly by setting a DataSource to the DataTable itself, and you can bind to a subset of a table by creating a DataView with a filter. In general, you cannot bind to an IEnumerable<T> (eg, a LINQ query); the databinding infrastructure can only handle an IList (non-generic) or an IListSource. This is true for any kind of...
-
When designing fluent APIs, one issue that comes up is partial type inference. If a method has two type parameters, there is no way to call it and only specify one of the type parameters (and leave the other inferred by the compiler) For example, suppose we are creating a type-safe wrapper around a parameterized SqlCommand. Ideally, it would be called like this: using(DbConnection connection = ...) { var result = connection.ExecuteScalar<int>( "SELECT COUNT(*) FROM TableName WHERE Modified > someDate", new { someDate } ); } Where the generic parameter specifies the return type. In order to implement this efficiently,...
-
A common chore in developing real-world C# applications is implementing value semantics for equality. This involves implementing IEquatable<T>, overriding Equals() and GetHashCode(), and overloading the == and != operators. Implementing these methods is a time-consuming and repetitive task, and is easy to get wrong, especially GetHashCode(). In particular, the best way implement GetHashCode() is much more complicated than return x.GetHashCode() ^ y.GetHashCode(). To simplify this task, I created a ValueComparer class: ///<summary> /// Contains all of the properties of a class that /// are used to provide value semantics. ///</summary> ///<remarks> /// You can create a static readonly ValueComparer for...
-
Last time, we saw that the this parameter to an instance method in a struct is passed by reference, allowing the method to re-assign this or pass it as a ref parameter. Due to limitations in the CLR, the this parameter to an iterator method is not a reference to the caller’s struct, and is instead a copy of the value. Quoting the spec (§7.6.7) When this is used in a primary-expression within an instance method or instance accessor of a struct, it is classified as a variable. The type of the variable is the instance type (§10.3.1) of the...
-
Usually, you cannot pass ref this as a parameter, since this is not a writable field. However, that’s not true for value types. The this field of a value type is a writable value. To quote the spec (§5.1.5) Within an instance method or instance accessor of a struct type, the this keyword behaves exactly as a reference parameter of the struct type (§7.6.7). Therefore, the following code prints 1: static void Main() { Mutable m = new Mutable(); m.Mutate(); Console.WriteLine(m.Value); } struct Mutable { public int Value; public void Mutate() { this = new Mutable(); MutateStruct(ref this); } }...
-
VB.Net’s Nothing keyword is is not the same as C#’s null. MSDN states, “Assigning Nothing to a variable sets it to the default value for its declared type. If that type contains variable members, they are all set to their default value”. In other words, the Nothing keyword is actually equivalent to C#’s default(T) keyword, where T is the type that the expression is used as. This can lead to nasty surprises with nullable types in conditional operators. In C#, the expression (...) ? null : 1 will not compile, since “there is no implicit conversion between '<null>' and 'int'”. ...
-
jQuery contains a powerful and flexible animation engine. However, it has some limitations, primarily due to underlying limitations of CSS-based layout For example, there is no simple way to slideUp() a table row (<tr> element). The slideUp animation will animate the element’s height to zero. However, a table row is always tall enough to show its elements, so the animation cannot actually shrink the element. To work around this, we can wrap the contents of each cell in a <div> element, then slideUp() the <div> elements. Doing this in the HTML would create ugly and non-semantic markup, so we can...
-
A generic class can specify that its generic parameter must inherit a type. However, there is no obvious way in general to prevent clients from passing the base type itself. For example, take the following set of types: abstract class Entity { } class Person : Entity { } class Boat : Entity { } class Car : Entity { } class Repository<TEntity> where TEntity : Entity { } This allows the type Repository<Entity>, which doesn’t make logical sense. In this particular case, we could prevent that by changing the generic constraint to where TEntity : Entity, new(). Since the...
-
In part 1, we discussed the simple approach to making a nested iterator. However, we fell short of a completely lazy nested iterator. In simple cases, we can make an separate iterator method for the subsequence: IEnumerable<IEnumerable<int>> FullyLazy() { for(int i = 0; i < 10; i++) yield return Inner(i); } IEnumerable<int> Inner(int i) { for(int j = 0; j < 10; j++) yield return i * 10 + j; } Note that this is actually smaller than the single-method implementation! This seems to work very well; the inner iterator code for a particular subsequence will not execute at all...
-
C# 2.0 introduced a powerful feature called an iterator, a method which returns an IEnumerable<T> or IEnumerator<T> using the new yield keyword. Using an iterator, you can quickly and easily create a method which returns lazily a sequence of values. However, lazily returning a sequence of sequences (IEnumerable<IEnumerable<T>>) is not so simple. The obvious approach is to yield return a List<T>: IEnumerable<IEnumerable<int>> SemiLazy() { for(int i = 0; i < 10; i++) { List<int> numbers = new List<int>(); for(int j = 0; j < 10; j++) numbers.Add(i * 10 + j); yield return numbers; } } (This can be shortened...
-
My previous post stretched the limit of simple copy prevention. Beyond this point, it gets very complicated. Before continuing, some thought is in order. Who are you trying to prevent from copying your text? Why shouldn't the text be copied? Unless you are trying to stop a hardcore developer, the previous methods should suffice. Also, what kind of copying are you trying to prevent? If you are trying to prevent the copier from copying into a web page, it is significantly harder, because he can copy your source and it will display normally. I can think of two ways to...
-
The methods discussed in my previous post are crude and ugly. Most of the time, they do work, but they do nothing to prevent the user from viewing the source and copying the text from there. Also, the user has a right to select text that should not be denied. For example, if one wants to show someone part of a large document, the easiest way to do that is to select the part. Paste here. ZSkTuKpBrLljyVW GmtoBbO MVocxRvoopy zKYtQahiDEsh LLtQexowSEtDnIg. NoyticDMe thiMaDVnZt, whGZenjEE ufapdeIPasBZxtgCeYWDd, iSt BlMNooks KPzRlkeeGifkshqdheodB tIVnoMNtEal nySouQnAqVsensegX. cUHHoNweqdcvecFGrU,PGZ pMibt rqcanrbKkn eHstilqTulOE beRPuv STwaQsyTePXvplRoCectxeKAjd jVpnXljoDYrDlrmaKlly.B IiLwokzofk at itsjw...
-
Many web developers like to prevent their viewers from copying their text. While I do not approve of this, there are cases where it is appropriate. The simplest way to achieve this is to use the IE only attribute UNSELECTABLE and the FireFox only css style -moz-user-select. Such HTML looks like this: <DIV unselectable="on" style="-moz-user-select:none;"> You can't select me. </DIV> You can't select me. To make the HTML and CSS validate, one could do this in Javascript: Elem.unselectable = "on"; Elem.style.MozUserSelect = "none"; However, this method only works in IE and Firefox. In addition, in IE, it doesn't work very...